Welcome to the May 2024 edition of our monthly blog series, highlighting a few of Ternary’s latest FinOps enhancements. In April, we featured new report subscriptions and an update to Ramp Plans. Today, we’re excited to share the FinOps roundup for May, which includes our new navigation search engine, dashboard enhancements, and an update to our unit economics reporting.
Purpose-built for FinOps, Ternary empowers organizations to establish cloud cost transparency, improve cost and usage efficiency, and foster communication between teams. Today, Ternary manages more than $7B in multi-cloud spend across leading enterprises and managed service providers. Read on to discover how our new enhancements help partners and customers progress on their FinOps journey.
Navigation search engine
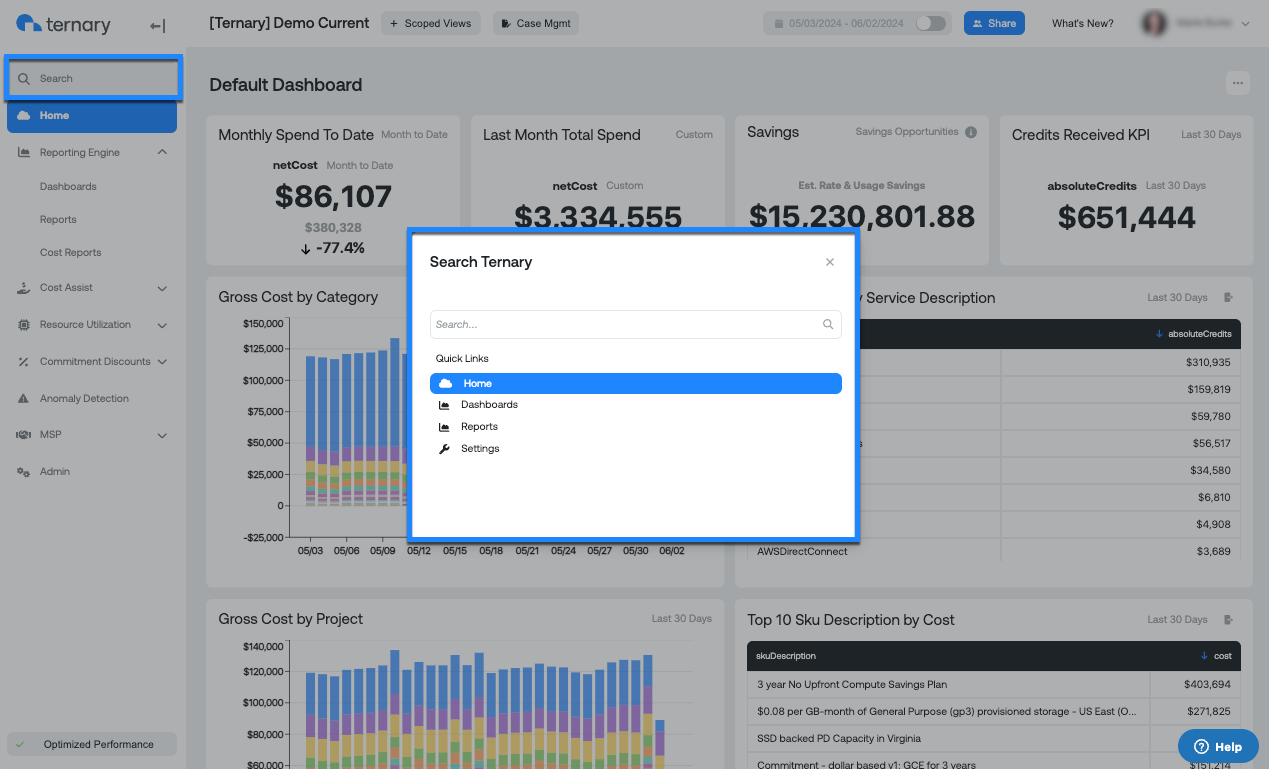
At Ternary, we pride ourselves on having a platform that is user-friendly for everyone, from engineers to finance professionals. Today, we’re excited to introduce a navigation search engine to further enhance the user experience. With this release, you can now navigate to any page within the Ternary platform by searching its name or related keywords.
With the Ternary search engine, you can quickly and easily:
- Find specific reports, dashboards, and budgets
- Jump to featured pages within the navigation (e.g., Compute Insights under Resource Utilization)
- Access the administrative pages (permissions required)
- Navigate via keyboard controls (e.g., “/” to open, “esc” to close, etc.)
MSP Dashboard
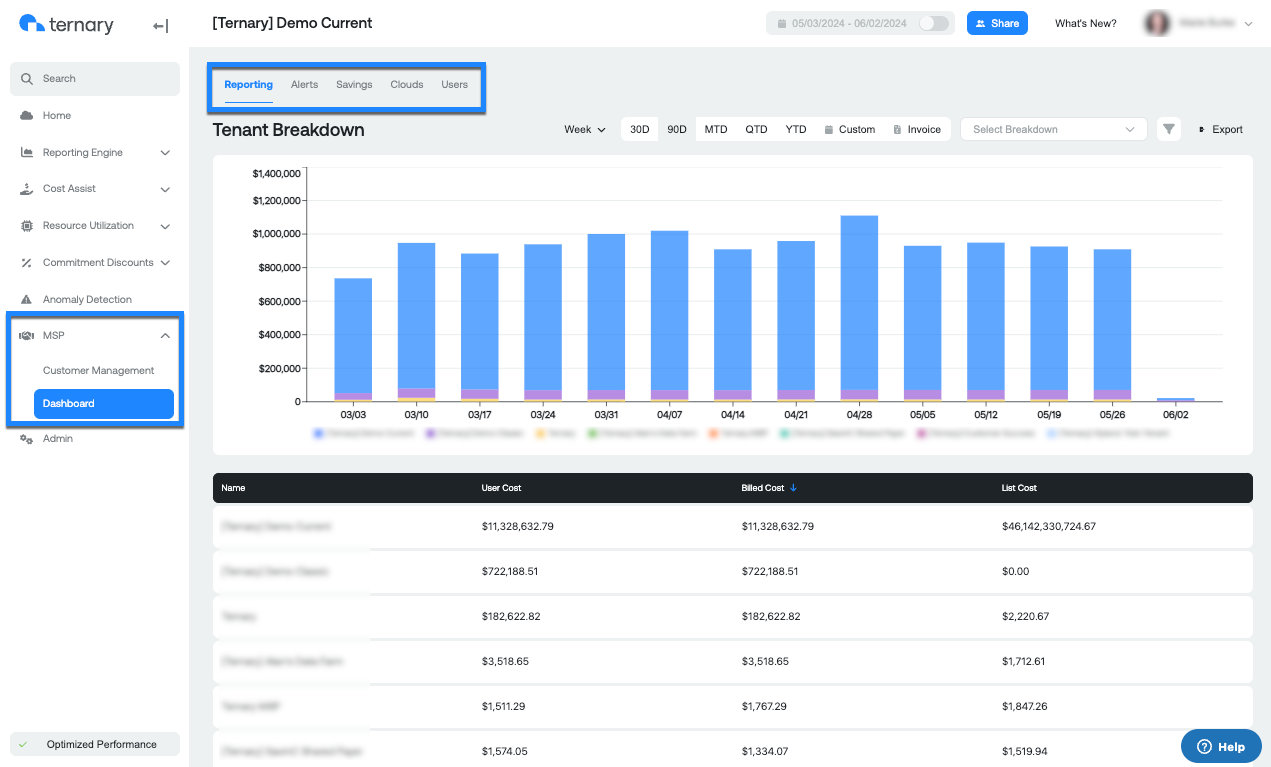
We’re excited to introduce a new dashboard for MSPs, providing a holistic view across their entire FinOps services business. Partnering with managed service providers (MSPs) has been a core component of Ternary’s strategy since our inception. As more partners choose Ternary, we are investing in new capabilities to support MSPs as they build, deliver, and manage their FinOps services.
This new, centralized dashboard streamlines customer management. Specifically, it allows you to easily view key information across all customers and clouds, without having to access each individual customer tenant. Under the MSP navigation pane, you can now access a range of useful summaries. These include cost history and monthly trends, anomalies, savings opportunities, cloud data status, and customer tenant user activity and access.
The image below shows just one of the five views available in the new MSP Dashboard.
Dashboard widget: Savings Opportunities
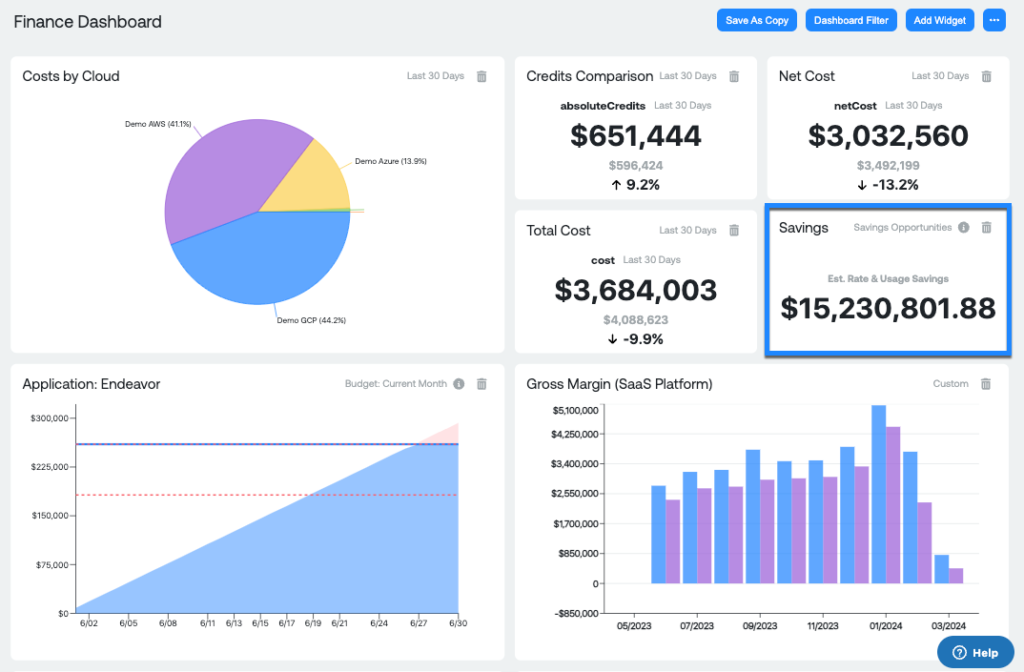
We continually improve dashboards to help you access the information that’s most important to your business. In March, we introduced budget widgets for custom dashboards. Today, we’re excited to share that you can create widgets displaying the estimated total savings associated with rate and/or usage recommendations. You can use the available system widgets or build your own. Either way, you can easily add these widgets to any dashboard.
Unit economics update: custom metrics
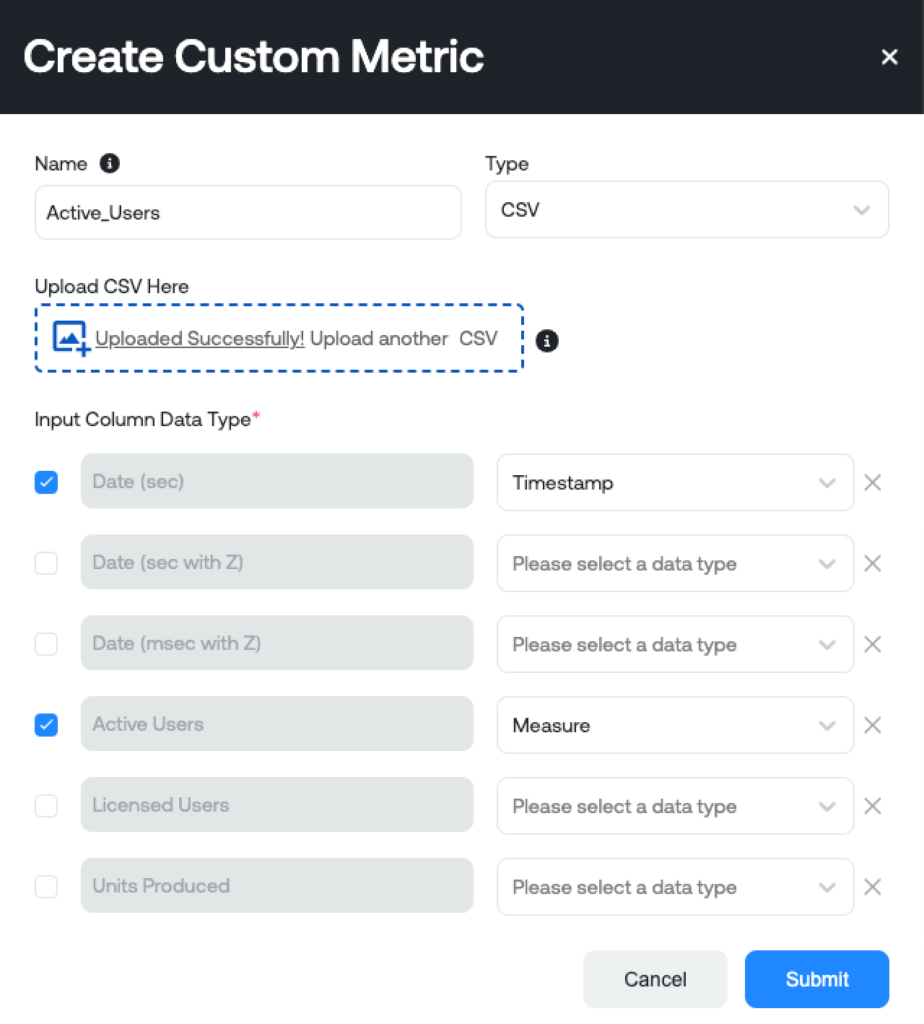
Ternary helps you drive efficiency and profitability in the cloud by surfacing unit economics insights. Now, you can load unit economics data via the Ternary user interface. (Previously, this was only available via BigQuery Table loads.) Just upload a CSV file with business inputs corresponding to cost data, such as “active users” or “transactions processed.” Our platform will then determine a cost per unit of output.
The Ternary team is dedicated to helping our customers and partners throughout their FinOps journey. Our innovations reflect customer feedback, as well as industry trends and thought leadership from our expert team. Stay tuned for next month’s product enhancements. In the meantime, you can learn more about Ternary.
Discover how Ternary can help you tame your organization’s cloud spending.

