If you’re a FinOps practitioner, you’re likely familiar with the three FinOps Phases: Inform, Optimize, and Operate. We can think of these as “levers” you can “pull” on to optimize your cloud spend and foster accountability. In this blog, we’re covering Ramp Plans, a Ternary feature that unlocks a strategic conversation with cloud providers.
Ternary Ramp Plans allow you to visualize the financial commitments you’ve contracted to make to a cloud service provider (CSP), compare them against what you actually spend over a given period of time, and plan accordingly. Read on to explore this powerful feature.
See something, be something
Before we dive into how Ternary Ramp Plans can help you progress in your FinOps journey, let’s take a moment to appreciate the power of visualizing your cloud spend. As noted above, “Inform” is one of three FinOps Phases. The impact of this phase recalls the “observer’s paradox,” originally from quantum mechanics: By observing a phenomenon, we subject it to influence. In layperson terms, doing something under observation feels different from doing it without being scrutinized.
So how does this idea relate to cloud spending? By visualizing a business’s cloud spend—in the Ternary platform, and/or with showback/chargeback—a FinOps practitioner can potentially influence patterns of cloud spend. This is part of fostering a company-wide culture of accountability for cloud investments. Let’s look at how this works in the Ternary platform.
Inform yourself with Ternary Insights into Google Compute Engine
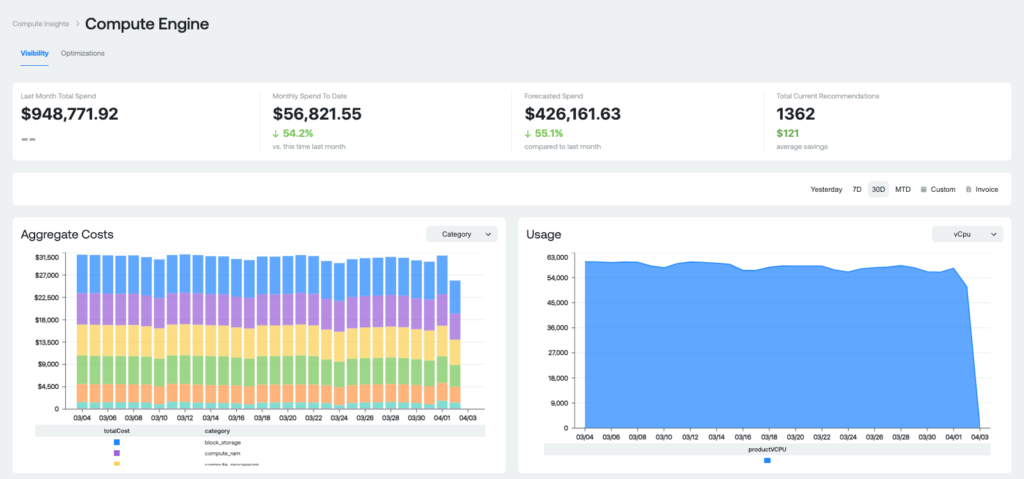

The Ternary platform enables you to analyze many aspects of your cloud investments, including compute patterns, with our Insights feature. Looking at the example chart of Google Compute Engine costs (above), you can see that the blue bar, representing compute processors, is the largest. This means that the largest potential for savings lies in optimizing compute processors. Optimizing block storage (purple bar), compute RAM (yellow bar), or IP charge (green bar), for example, won’t help nearly as much. That’s because they make up a comparatively small proportion of spend.
Ternary Insights also provide recommendations, under “Optimizations,” shown in the screenshot below. In this example, the user has unused static IP addresses or unattached storage that can be reduced to save money.

Understanding your historical consumption can help you identify the most impactful areas for reducing waste. In other words, seeing this pattern can unlock the chance to influence it.
Forecast your future spend
Ternary Ramp Plans provide a different opportunity for visibility and influence. Instead of confining insights to past behavior, Ramp Plans allow you to plan the future of your cloud spending and use that plan to save money.
A Ramp Plan allows you to forecast what you think you will spend over the next year and compare it with how much you actually spend. The process can inform cost-saving conversations inside and outside your organization.
Here’s how you can configure a Ternary Ramp Plan.
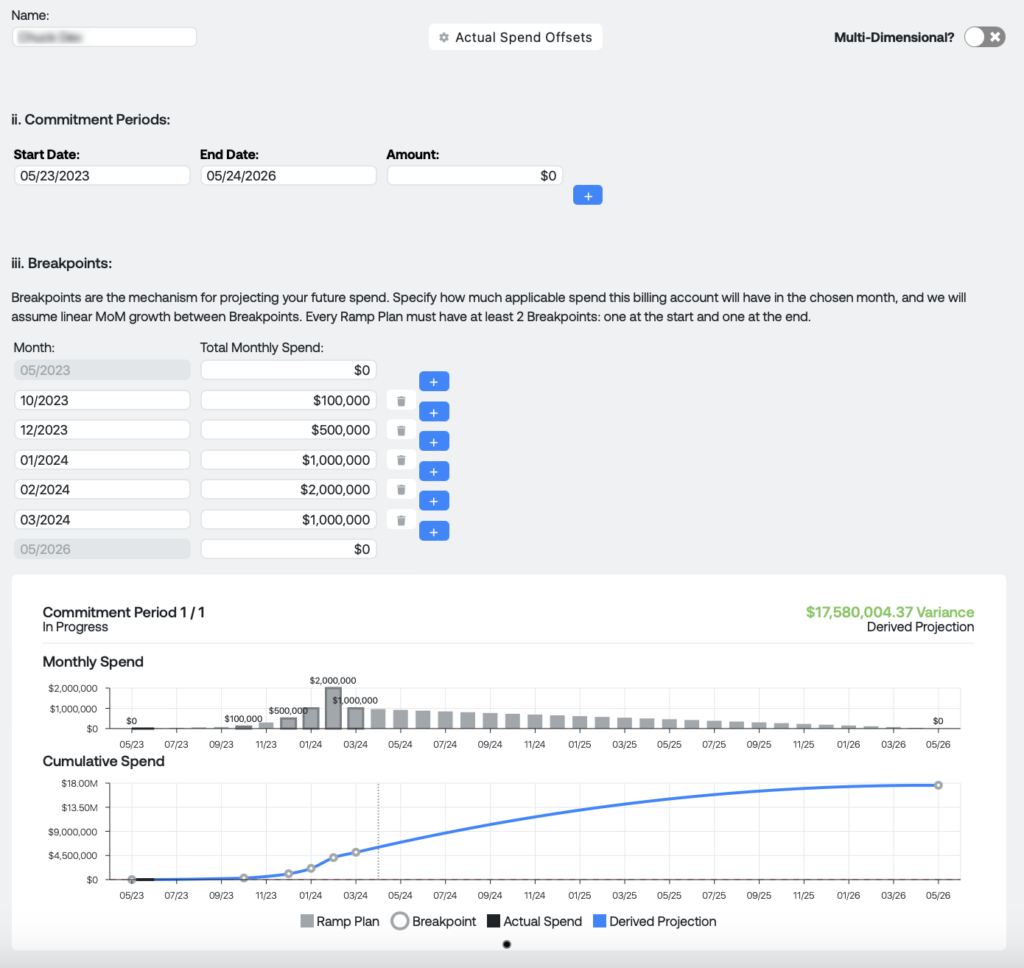
By drilling down into the customizable fields, we can explore how this works.
- Select Billing Account ID.
Selecting this ID populates data for your actual spending over time. The Billing Account ID represents the top-level account for your cumulative spend with a specific CSP (for example, AWS, GCP, or Azure). Some companies may have multiple billing accounts under a single provider, while others may have only one.
In this example, we can think of the Billing Account ID as belonging to a particular CSP, such as AWS.
2. Enter Start Date, End Date, and Amount.
These dates define the period of time covered by the Ramp Plan. Under Amount, enter the dollar amount you plan to commit to that billing account (e.g., the amount you’ll commit to spending on AWS over the defined period).
3. Enter Breakpoints.
Breakpoints allow you to subdivide the Ramp Plan’s time period into shorter chunks (months) for easier forecasting and benchmarking with actual spend. (Each Ramp Plan has a minimum of two breakpoints: at the start and at the end.) Under Total Monthly Spend, estimate what you think you’ll spend between those breakpoints.
Far from being arbitrary, breakpoints serve a key function in the Ramp Plan’s potential influence. Once you’ve loaded in your forecast, you can use the chart to inform conversations with colleagues. (Are we OK with spending these amounts over time? Does our outlay match what we spent last year? If it’s higher, is the increase justified? Does this plan account for future projects we want to include?) Once your team is comfortable with the numbers, you can approach your cloud provider and negotiate the best rate based on what you’re committing to spend there. Many CSPs have incentive programs in place for this purpose.
Combined with optimizations and discounts, this structured negotiation offers a key way to unlock savings. Some of Ternary’s largest customers have used this approach to achieve savings (or held costs flat) as they continue to grow.
Compare your Ramp Plan with your actual spend
After you’ve negotiated a commitment and rate with the CSP, and once the Ramp Plan period begins, Ternary can show how your actual spend compares with your forecast. If you start to see your actual spend topping your commitment, you can assess options for optimizing. These might include switching to smaller machines to save money or purchasing “voucher” offerings (e.g., Committed Use Discounts or Reserved Instances). You might also consider switching services (e.g., from Google Cloud Spanner to SQL) and/or shutting down idle or underused resources. Such comparisons between your actual spend and your commitment can inform more accurate planning. Plus, they can help you continue negotiating with CSPs for the best available rate.
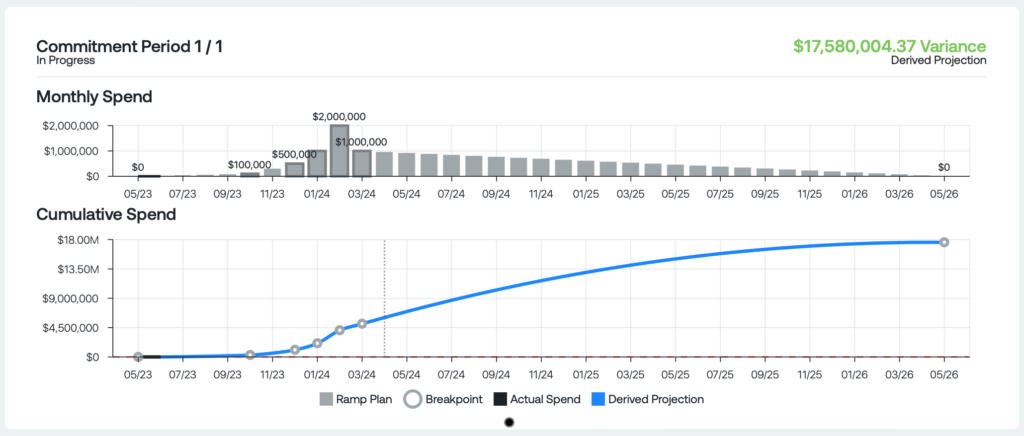
Here’s an example of actual spend compared with commitment and Ramp Plan:
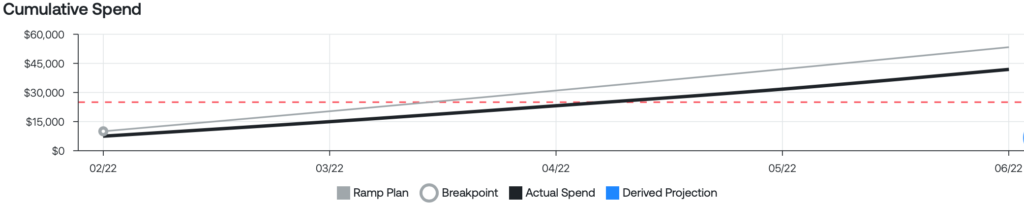
The dotted red line represents Commitment: the total amount you committed to spend over the Ramp Plan period. The gray line shows your Ramp Plan: how your spending is set to progress over time. The black line denotes actual spend.
Now consider the commitment snapshot below:
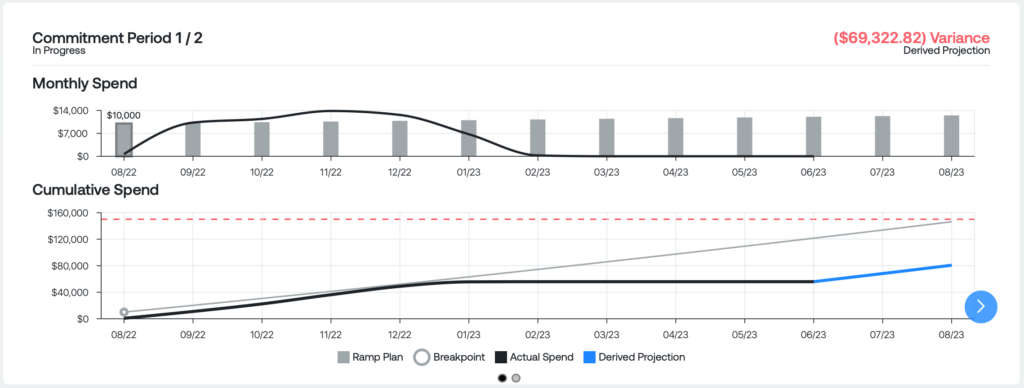
In this example, where the actual spend is well below the commitment, it doesn’t make sense to waste a lot of time and energy optimizing. After all, you’re contractually obligated to spend that amount. But seeing this divergence can help you consider making a smaller commitment in the future.
While other platforms may be able to pull in forecasts, they lack a capability, like Ternary’s, that allows you to compare your contractually committed spending with your actual spend, in a visual format that enables effective negotiations with CSPs.
Use Ternary Ramp Plans to further your FinOps journey
If you’re just starting your FinOps journey, Ternary Ramp Plans can help you model your future cloud spending. If you have a mature FinOps practice, Ramp Plans provide a good system of checks and balances. They help you decide if it makes sense to rightsize, optimize, buy discounts, etc. As the observer’s paradox implies, visualizing is not a passive activity. Instead, it can provide a means of influence inside and outside of your company.
A key FinOps objective is to facilitate collaboration between Finance, Engineering, and FinOps team members. Ramp Plans foster communication and planning between these groups, as well as between customers and cloud providers.
We hope this blog has helped you see the power of Ternary Ramp Plans and how they can enable you to not only save money but also foster a culture of communication and efficiency. To learn more about Ramp Plans and Ternary’s other powerful FinOps capabilities, book a demo today.