Welcome to the August 2025 edition of our monthly FinOps feature roundup. Each month, we share the latest Ternary innovations designed to improve cloud cost transparency, boost efficiency, and strengthen collaboration across teams.
Last month, we introduced enhanced timeframe controls in reporting, launched a new integration with OpenOps, and added a fresh set of product explainer videos. This month, we’re excited to highlight user experience improvements in the Ternary Reporting Engine and Forecasting. Additionally, we released three new explainer videos to help you get even more out of the platform.
Read on to see how our latest enhancements enable customers to maximize the value of their cloud investments and help partners scale their FinOps services.
Ternary Reporting Engine enhancements
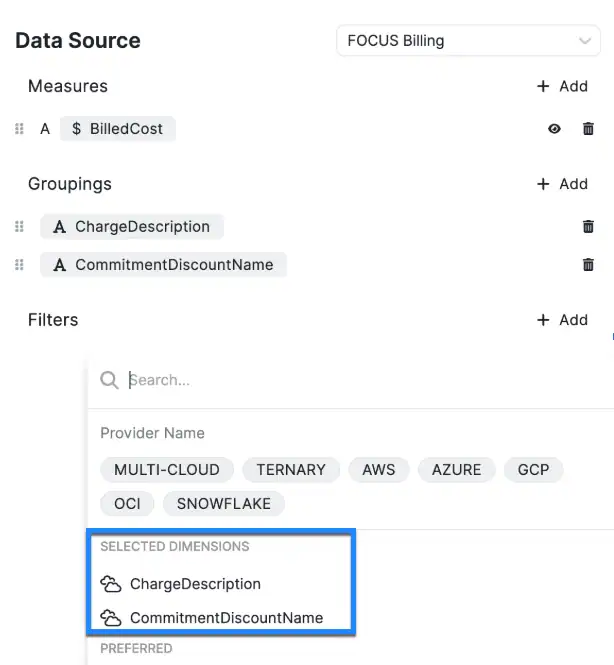
We’ve enhanced the Ternary Reporting Engine to give you clearer insights and smoother navigation across your dashboards and reports. The new Show Totals feature lets you display overall values directly on bar charts in both Reports and Dashboards. This makes it easier to see the big picture while still accessing detailed breakdowns.
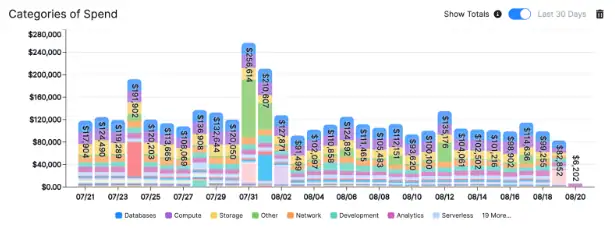
Plus, with selected groupings now surfaced at the top of your filters list, organizing and adjusting your reports is faster and more intuitive. These updates help teams understand total values, compare group-level performance, and take action on the insights that matter most.
For partners providing FinOps as a Service, these improvements make it easier to demonstrate value by showing both aggregate and detailed spend in a unified view. They also support more focused customer conversations, giving partners more time to deliver strategic analysis and actionable recommendations.
Forecasting enhancements
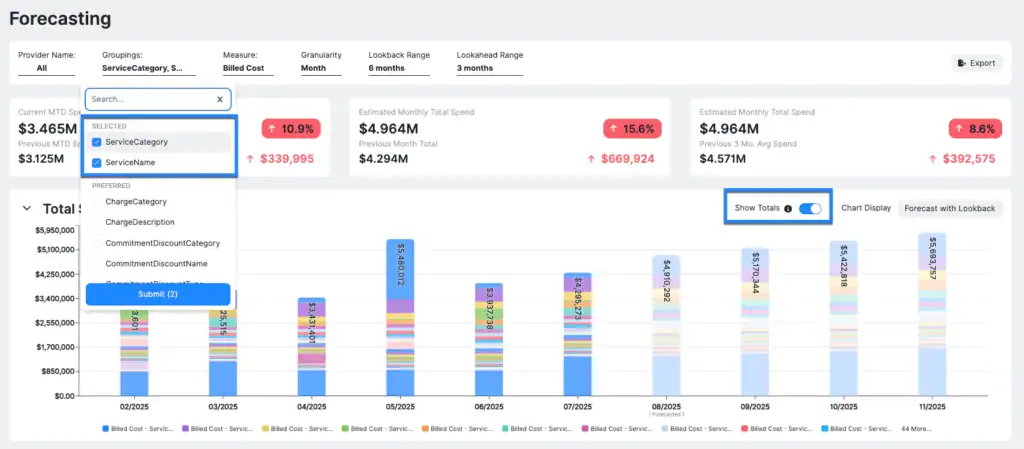
We’ve also upgraded Ternary Forecasting to give you greater clarity and flexibility in managing projections. With the new Show Totals feature, you can now view overall projected spend directly alongside group-level forecasts. This gives you a clear high-level picture without losing the detail that matters. Plus, selected groupings now surface at the top of your filters list, making it faster to review and adjust dimensions during setup. These improvements streamline the forecasting process, reduce friction in analysis, and help you better understand projected spend across key dimensions.
For partners delivering FinOps as a Service, these updates enable faster, more tailored forecasting based on customer-specific dimensions. This makes it easier to compare total cloud spend with group-level contributors, helping teams streamline workflows and spark more meaningful conversations about budgets, trade-offs, and efficiency. Ultimately, partners can scale their service impact more effectively.
New videos: Ternary in 90 Seconds or Less
Our Ternary in 90 Seconds or Less video series continues with three new episodes designed to help you get more out of your FinOps practice.
The first video, Custom Dashboards, walks you through creating dashboards tailored to your team’s goals. Whether you’re tracking spend by provider, monitoring budgets, highlighting savings KPIs, or giving executives a high-level view, this video shows you how to build exactly what you need.
The next video covers Scoped Views, a powerful way to filter cloud cost data by business unit, team, or product line using Ternary Custom Labels or vendor-defined labels. Scoped Views make it easy to create, share, and save meaningful cost perspectives across your organization.
The third video focuses on Forecasting and shows how quickly you can project spend, such as Oracle Cloud Infrastructure costs over the next three months. This helps you avoid surprises and budget with confidence. Together, these videos show how Ternary equips every stakeholder with tailored, actionable insights to support smarter cloud cost management.
The Ternary team is here to support your FinOps journey. Thanks for reading our August 2025 FinOps roundup. Stay tuned for next month’s updates!
See Ternary in action!