Kubernetes usage and costs continue to go up, so what are you doing about it? The most recent microsurvey report by the Cloud Native Computing Foundation (CNCF) stated that Kubernetes had driven cloud spend up for nearly half (49%) of survey participants. Cloud service providers have responded by augmenting native tools: In April 2024, Amazon Web Services (AWS) announced it would improve cost visibility for Amazon Elastic Kubernetes Service (EKS), using AWS split cost allocation data.
But too few companies operating in the cloud are pursuing greater visibility, even as their Kubernetes costs rise. According to that same CNCF report, 40% of respondents said they estimated their Kubernetes costs, while 38% didn’t monitor them at all. CNCF also reported that only 19% of respondents did accurate showback for Kubernetes costs, and only 2% did chargeback.
It’s startling to think that nearly 40% of organizations don’t monitor their Kubernetes usage at all, despite these costs rising. There’s been progress in the FinOps space to provide better Kubernetes transparency, and several point solutions exist in the market. But these figures reveal a huge opportunity for increasing Kubernetes visualization. This blog explains how.
Want optimization? Start with visualization.
Optimization of cloud costs is always a hot topic. But without visibility, how can you know what to optimize, with whom to collaborate on changes, or how those changes could impact the broader environment? How can you track potential savings?
In a previous blog, we delved into how you can use Kubernetes to spin up and shut down cloud applications dynamically, using containers. In this blog, we’ll dive into the crucial step of visualization, without which optimization is just a pipe dream.
Specifically, we’ll cover native tools for Kubernetes visibility from each of the major cloud service providers (AWS, Microsoft Azure, and Google Cloud). But many companies have complex cloud environments, for which native tools aren’t enough. So we’ll explore how Ternary can help you monitor and optimize these costs across clouds, without the need for a specialized “point” solution devoted solely to Kubernetes.
1. Amazon Web Services (AWS)
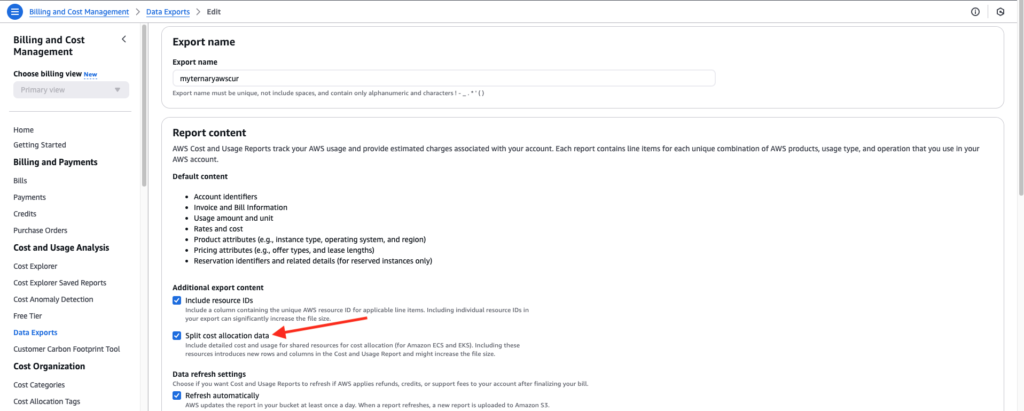
As we mentioned above, last April, AWS announced that it would include AWS split cost allocation data in customers’ current Cost and Usage Reports (CUR), allowing them to visualize their Kubernetes costs in a more granular fashion. Accessing this data is straightforward, requiring zero engineering effort. Simply follow these steps:
- On the AWS Billing and Cost Management page, navigate to the Cost Management Preferences page and enable split cost allocation data for Amazon EKS.
- Returning to the AWS Billing and Cost Management page, navigate to Data Exports, find your current CUR, and enable split cost allocation data.
Done!
Once you have completed these steps, within 24 hours, your CUR will be populated with the following columns:
- lineItem/ResourceId
- lineItem/LineItemType
- lineItem/UsageType
- lineItem/UnblendedCost
- splitLineItem/ParentResourceId
- splitLineItem/SplitUsage
- splitLineItem/SplitCost
- splitLineItem/SplitLineItem/UnusedCost
Your CUR will also include AWS natively generated tags related to your EKS usage:
- aws:eks:cluster-name
- aws:eks:namespace
- aws:eks:node
- aws:eks:workload-type
- aws:eks:workload-name
- aws:eks:deployment
2. Microsoft Azure
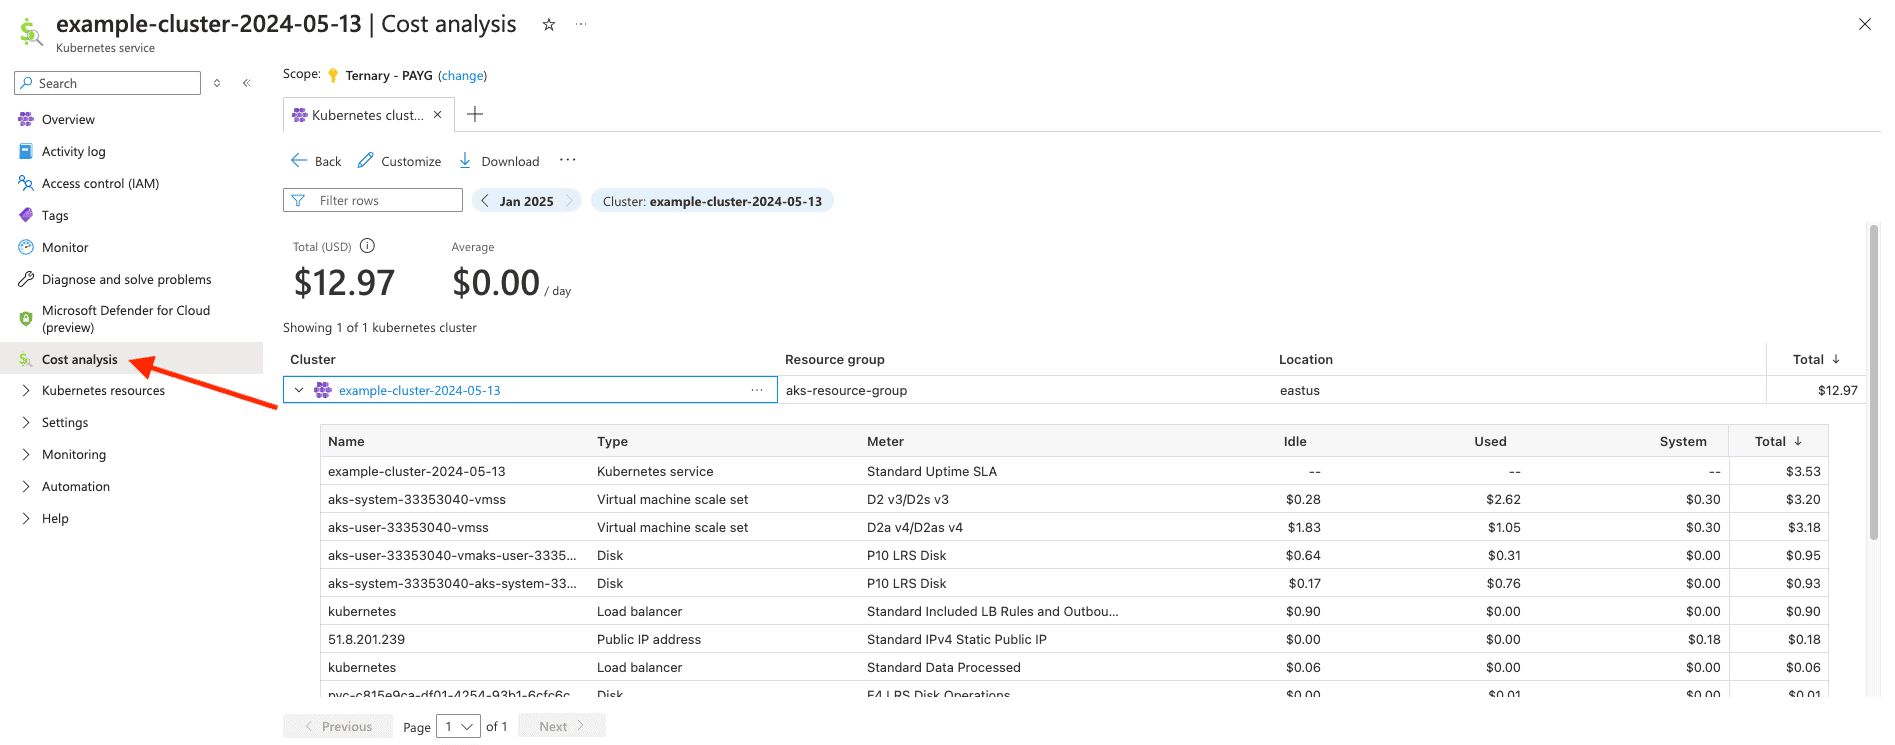
In August 2024, Azure Kubernetes Service (AKS) began offering “cost analysis” for your AKS cluster, including data about your AKS usage, in Azure billing exports.
To take advantage of this enhancement, use the Azure Command-Line Interface (CLI) to enable cost analysis when creating a new AKS cluster or when updating an existing cluster, as follows.
(Note: To access this data, your AKS cluster must be either standard tier or premium tier; the free tier does not qualify. You must also have a Microsoft Enterprise Agreement or a Microsoft Customer Agreement.)
- Create a new AKS cluster.
az aks create –resource-group <resource-group> –name <cluster-name> –location <location> –enable-managed-identity –generate-ssh-keys –tier standard –enable-cost-analysis - Update an existing AKS cluster.
az aks update –resource-group <resource-group> –name <cluster-name> –enable-cost-analysis
Done!
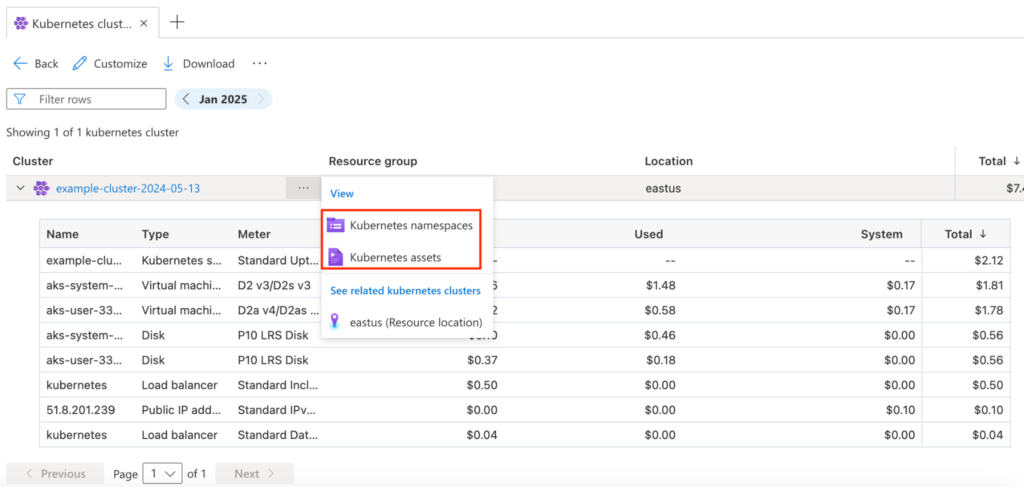
Once you have completed one of these steps, within 24 hours, you will be able to see the cost by namespace in the Azure console. (Unfortunately, that data is not currently available in Azure billing exports.)
3. Google Cloud (GCP)
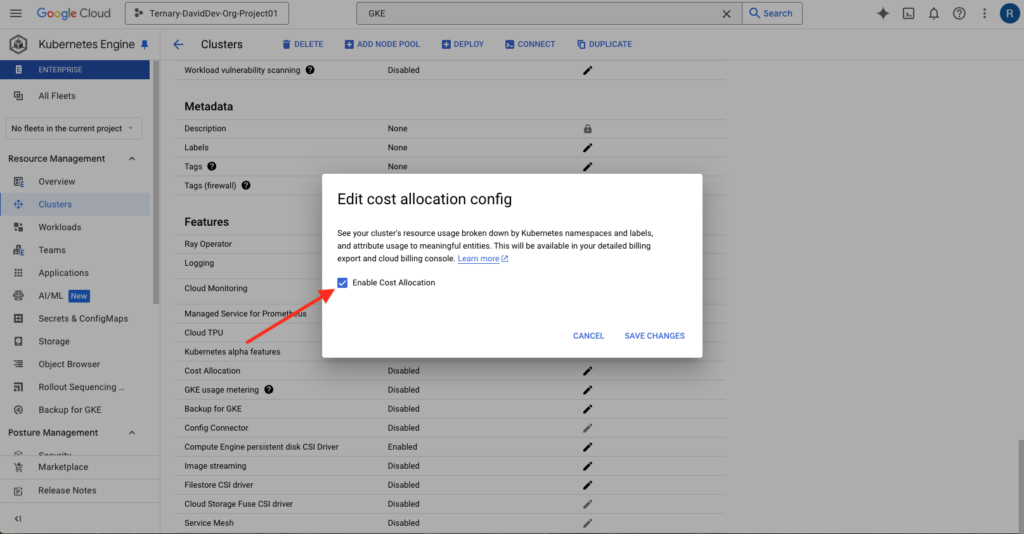
GCP offers functionality called Google Kubernetes Engine (GKE) cost allocation. GKE allows you to get additional visibility into your cluster-level costs by including additional data in the Detailed Billing Export in BigQuery. (GKE Autopilot clusters have cost allocation enabled by default, while standard clusters require that you enable it manually.) You can do this using one of the following steps:
- Create a new GKE cluster. Enable GKE cost allocation during setup, by selecting “Enable Cost Allocation” in the “Other” section.
- Update an existing GKE cluster. Navigate to the Clusters page and then to the Features section. Click “Cost Allocation,” then “Enable Cost Allocation.”
Done!
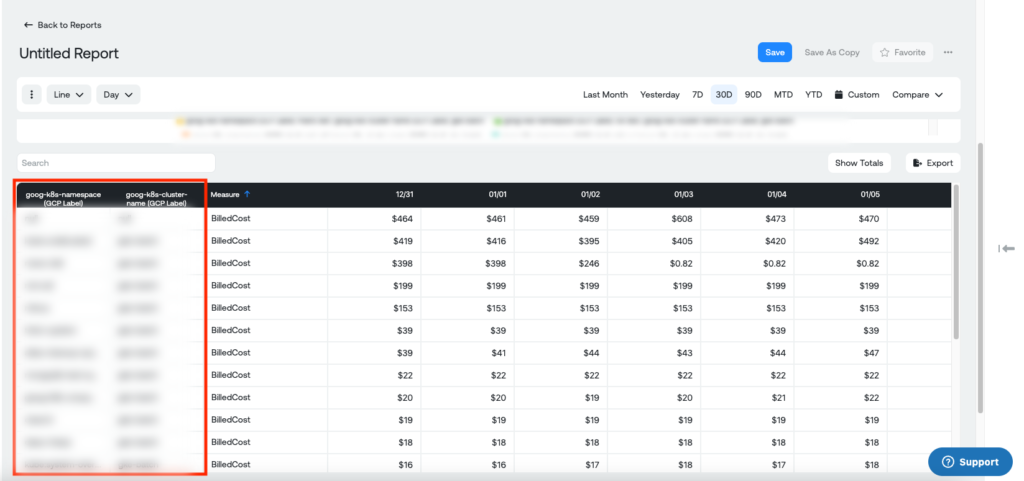
Once you have completed one of these steps, within 24 hours, your GCP billing export will be populated with the following additional columns:
- k8s-label/${your-organizations-k8s-label-key} where your-organizations-k8s-label-key is the key of the Pod’s Kubernetes label
- goog-k8s-cluster-name
- k8s-namespace
- k8s-workload-type
- k8s-workload-name
Ternary’s multi-cloud Kubernetes visualization
It may make sense to use native solutions if your organization:
- Uses only a single cloud service provider
- Has already built your own internal cloud cost management tool
- Has a dedicated team that maintains and improves the internal tool, monitoring for changes from your cloud service provider(s) and updating your internal billing data schemas
But what if you have multiple cloud service providers? What if you don’t have that internal tool or a dedicated team? Then it can be challenging to even understand how much you are spending, what you are spending it on, and who is spending it. And if you add the complexity of Kubernetes spend—which can largely be “hidden,” grouped as a single line item (e.g., “Amazon Elastic Kubernetes Service” or “Azure Kubernetes Service”)—tracking those aspects of your spending becomes a huge challenge.
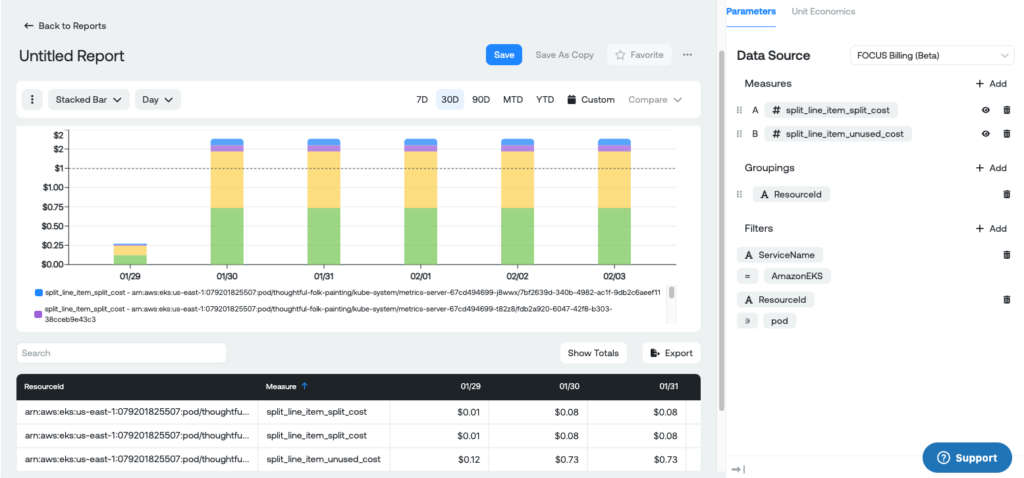
Once you enable the relevant additional Kubernetes labels, Ternary automatically ingests that data into our platform. You can then seamlessly integrate it with any of your cloud service providers (CSPs) that we support (AWS, Azure, GCP, OCI, MongoDB, Alibaba, and Snowflake). From there, you can use Ternary’s custom label engine to properly allocate the spend according to your business’s hierarchy or taxonomy.
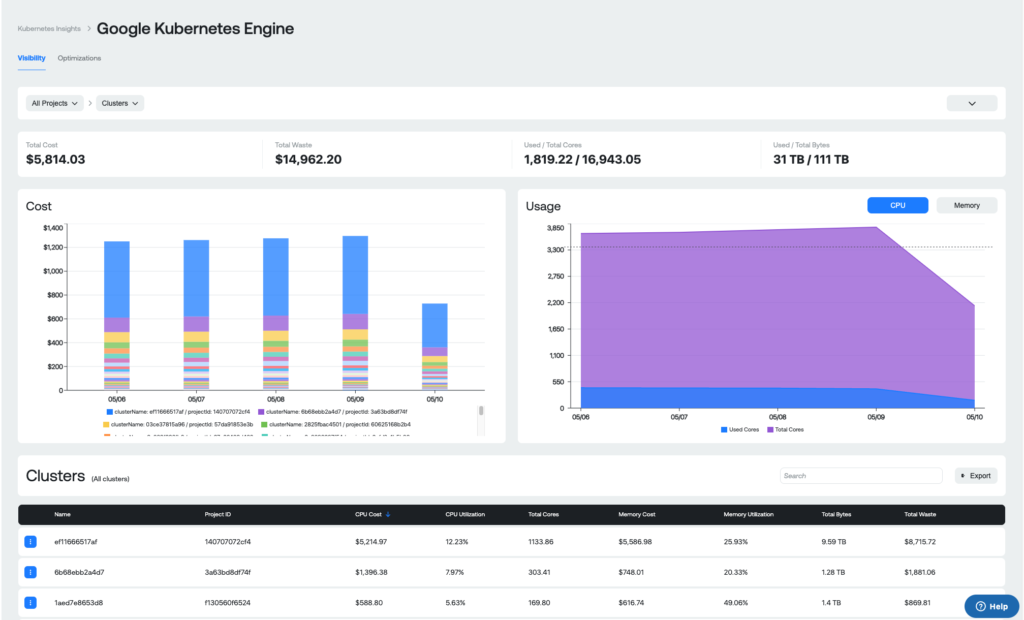
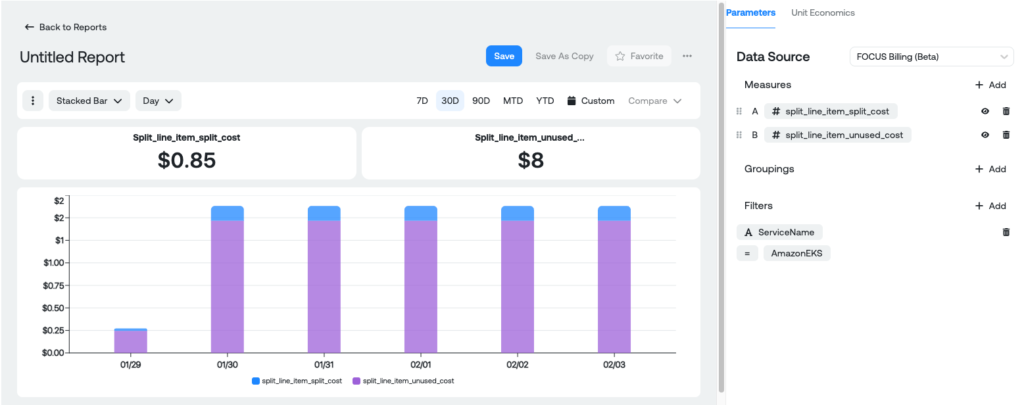
Using this rich reporting data, you can not only gain in-depth visualization but also take steps toward optimization. For example, you can immediately use AWS’s native measures to show used cost vs. unused cost in the cluster, or you can show costs broken down by namespace, workload, and even individual pods.
Ternary gives you the ability to properly allocate all of your Kubernetes costs back to the business, find opportunities for optimization, and include granular Kubernetes cost data in your showback and chargeback processes.
Ready to get granular with Kubernetes?
We hope you’ve found this blog helpful in showing how you can gain the visualization that’s so sorely lacking when it comes to Kubernetes. If your cloud environment is relatively simple, or if you have dedicated resources in place, native cloud consoles can provide some degree of transparency. And if you’re multi-cloud, as many customers are, you can use Ternary for granular Kubernetes visibility across a range of clouds. As we’ve shown, visibility paves the way for optimization.
Learn more about how Ternary can illuminate your
Kubernetes spending.